Phase Diagrams


Topic Description
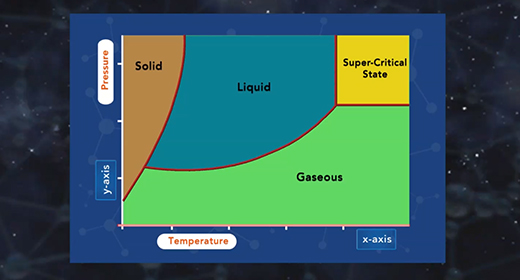
Upon completion of this module, you should be able to describe the major components of a phase diagram and interpret a phase diagram and define a critical point and triple point. A phase diagram represents the three physical states of a substance—solid, liquid, and gas—graphically under different conditions of temperature and pressure. In a phase diagram, the pressure is on the y-axis, and the temperature is on the x-axis. As one moves cross/across the edges or curves of a phase diagram, a phase change occurs. Two phases of the substance coexist in equilibrium on the lines, borders, or curves. The phase diagram shows the three main phases of matter. They are solid, liquid, and gas.

The topic "Phase Diagrams" is available as part of this package. Subscribe this package to get access to this topic.

